In this article I have discussed about Standard deviation (Sample & Population) explained with examples. Standard deviation is a statistical topic. It is usually found by taking the square root of the variance. In statistical analysis, the standard deviation is used frequently. The branch of science in which gathering data and unwrapping patterns are taken and then summarize that data is known as Statistical analysis.
To measure the distribution of the statistical data standard deviation is used. In this post, we will learn about standard deviation and how to calculate it with a lot of examples.
Definition – Standard Deviation
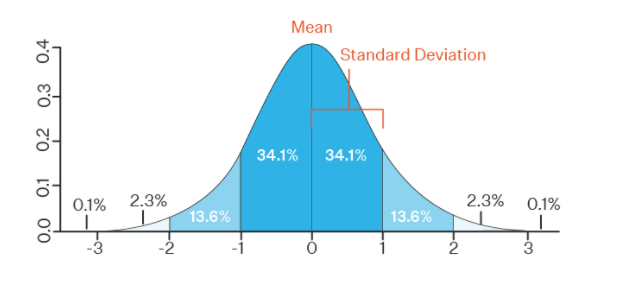
The standard deviation is a quantity of the data that talks about the variation from the mean. In other words, the degree of distribution of the data points compared to its mean is known as the standard deviation.
The results of the standard deviation tell whether it tends close to the mean or far. If the standard deviation is low, it tends closer to the meanwhile if the standard deviation is high, it concludes that standard deviation tends far from the mean value.
Closeness and farness of the standard deviation from the mean value decide the variation of the data. There is a small variation in data if data is close to the mean whereas if the data is far from the mean, there is a large variation. It is based upon the data values.
Standard deviations can take the sample data as well as population data. The given data values are used to find the standard deviation, the change in at least one value from the data can change the value of the standard deviation. Standard deviation (Sample & Population) explained with examples.
Standard deviation is usually written as SD and it is denoted by sigma. Sigma is denoted by σ. The formula for the standard deviation is:
Standard deviation of population data = σ = √ Σ (x – µ)2/N
In the above equation, σ is the population SD, N is for the total observation of the population data, µ is used for the population mean, and x is the observation of the population data.
Standard deviation of sample data = s = √ Σ (x – x¯)2/n – 1
In the above equation, x¯ is the sample mean, x is the data of the sample, and n is the number of observations of sample data.
How to calculate standard deviation?
By using formulas, we can easily find the standard deviation of the given data. You can also use standard deviation calculator to find the standard deviation and variance for sample as well as population data.
Example 1: For sample data
Find the standard deviation of the given sample data, 2, 4, 5, 9, 13, and 33?
Solution
Step 1: Write the given sample data.
2, 4, 5, 9, 13, 33
Step 2: Now evaluate the mean of the given data.
Sum of sample data = 2 + 4 + 5 + 9 + 13 + 33
Sum of sample data = 66
Total number of observations = n = 6
Sample mean = Sum of sample data / Total number of observations
Sample mean = 66/6 = 11
Step 3: Now find the square of the difference of sample observation and the sample mean.
| Sample data (x) | x – x¯ | (x – x¯)2 |
| 2 | 2 – 11 = -9 | (-9)2 = 81 |
| 4 | 4 – 11 = -7 | (-7)2 = 49 |
| 5 | 5 – 11 = -6 | (-6)2 = 36 |
| 9 | 9 – 11 = -2 | (-2)2 = 4 |
| 13 | 13 – 11 = 2 | (2)2 = 4 |
| 33 | 33 – 11 = 22 | (22)2 = 484 |
| Σ x = 66 | Σ (x – x¯)2 = 658 |
Step 4: Now take the general standard deviation formula for sample data.
Standard deviation of sample data = s = √ Σ (x – x¯)2/n – 1
Step 5: Put all the calculated values in the above formula.
s = √ Σ (x – x¯)2/n – 1
s = √ (658/ 6 – 1)
s = √ (658/5)
s = √ (131.6)
s = 11.4717
Example 2: For population data
Standard deviation (Sample & Population) explained with examples.
Find the standard deviation of the given population data, 12, 14, 15, 9, 13, 17, and 11.
Solution
Step 1: Write the given population data.
12, 14, 15, 9, 13, 17, 11
Step 2: Now find the sample mean of the population data.
Sum of population data = 12 + 14 + 15 + 9 + 13 + 17 + 11
Sum of population data = 91
Total number of observations = N = 7
Sample mean = µ = Sum of sample data / Total number of observations
Sample mean = µ = 91/7 = 13
Step 3: Now find the sum of squares of the population data.
| Population data (x) | x – µ | (x – µ)2 |
| 12 | 12 – 13 = -1 | (-1)2 = 1 |
| 14 | 14 – 13 = 1 | (1)2 = 1 |
| 15 | 15 – 13 = 2 | (2)2 = 4 |
| 9 | 9 – 13 = -4 | (-4)2 = 16 |
| 13 | 13 – 13 = 0 | (0)2 = 0 |
| 17 | 17 – 13 = 4 | (4)2 = 16 |
| 11 | 11 – 13 = -2 | (-2)2 = 4 |
| Σ x = 91 | Σ (x – µ)2 = 42 |
Step 4: Now take the general standard deviation formula for population data.
Standard deviation of population data = σ = √ Σ (x – µ)2/N
Step 5: Put all the calculated values in the above formula.
σ = √ Σ (x – µ)2/N
σ = √ (42/7)
σ = √ (6)
σ = 2.4495
Example 3
Find the standard deviation of the given population data, 2, 4, 9, 17, 19, and 21?
Solution
Step 1: Write the given population data.
2, 4, 9, 17, 19, 21
Step 2: Now find the sample mean of the population data.
Sum of population data = 2 + 4 + 9 + 17 + 19 + 21
Sum of population data = 72
Total number of observations = N = 6
Sample mean = µ = Sum of sample data / Total number of observations
Sample mean = µ = 72/6 = 12
Step 3: Now find the sum of squares of the population data.
| Population data (x) | x – µ | (x – µ)2 |
| 2 | 2 – 12 = -10 | (-10)2 = 100 |
| 4 | 4 – 12 = -8 | (-8)2 = 64 |
| 9 | 9 – 12 = -3 | (-3)2 = 9 |
| 17 | 17 – 12 = 5 | (5)2 = 25 |
| 19 | 19 – 12 = 7 | (7)2 = 49 |
| 21 | 21 – 12 = 9 | (9)2 = 81 |
| Σ x = 91 | Σ (x – µ)2 = 328 |
Step 4: Now take the general standard deviation formula for population data.
Standard deviation of population data = σ = √ Σ (x – µ)2/N
Step 5: Put all the calculated values in the above formula.
σ = √ Σ (x – µ)2/N
σ = √ (328/6)
σ = √ (54.6667)
σ = 7.3937
Summary
Standard deviations can easily be calculated by using the above formulas. You can grab the basic concept of this article. Once you grab the basic knowledge of standard deviation, you can easily solve all the problems related to this topic.
also read here
https://eevibes.com/computing/introduction-to-computing/what-are-number-systems/
What are the Different Types of Number Systems in Computing?