How to perform object extraction and shape identification of traffic signs?
How to perform object extraction of traffic signs? In this article we present the next stage of our traffic sign recognition system, namely, object extraction and shape identification. After the color attribute we know that shape is another distinguished attribute of road signs, which can be used to identify the type of a road sign more precisely, as road signs have distinguished colors and shapes. We have already used one attribute but similar background or objects could mislead the detection process. So we specify our search by looking for a red circular or triangular object Connected components are labeled and only those blobs are selected that have size greater than a certain threshold. This is to avoid unnecessary objects having similar attributes, and this also discards the faraway signs. Shape identification will also define to which class the traffic signs belongs i.e., triangular or circular. Detected shapes are extracted from the image to further proceed for the next step.
Connected Component Labeling:
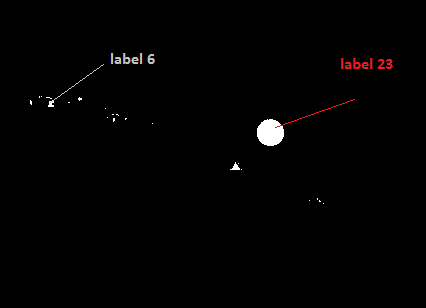
After segmentation we have a black and white image in which the sign is extracted as a white blob, i.e., connected component. Next, we need to detect the number of connected components. Connected components labeling scans an image and groups its pixels into components based on pixel connectivity, i.e. all pixels in a connected component share similar pixel intensity values and are in some way connected with each other. Once all groups have been determined, each pixel is labeled with a gray level or a color (color labeling) according to the component it was assigned to. Connectivity can be 4-connectivity or 8-connectivity.The pixel labeled 0 is background pixels and pixel labeled 1 makeup one object and so on. We have used 8-connectivity so that we can detect every connected object in the image and are labeled afterwards as shown in the Figure below
We have used connected component algorithm that follows the steps mentioned below
- Run the entire length input image.
- Formulate the table by assigning first round labels equivalences in local equivalence table.
- Determine the equivalence classes
- Again label the runs based on the newly determined equivalence classes.
Circular or triangular class identification:
Once the image is labeled, we need to extract only those regions with the size greater than some threshold, i.e., traffic sign blob will have a significant size in the black and white image with some characteristics. We then measure certain properties of images labeled. These properties are discussed below:
Area:
It will give the actual number of pixels in the region. The circular or triangular traffic sign will have greater number of pixels than other blobs in the image.
Eccentricity:
It is the ratio of the distance between the foci of the ellipse and its major axis length. It is a quantity to define a conic section and tells how closer a conic shape is closer to a circle. A circle’s eccentricity is zero and it varies from 0 to 1 for an elliptical shape.
Perimeter:
Number of pixels around the blob is its perimeter. A pixel is a part of the perimeter if it is non zero and is connected to one zero value pixels.
Bounding Box:
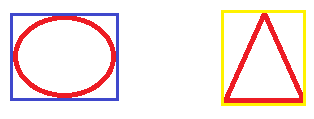
It is the coordinates of the rectangular border that fully encloses an image or region. So a bounding box will be drawn on each labeled blob such that it completely encloses the shape. We present two different shapes being bounded by a box in figure below
Circular class identification:
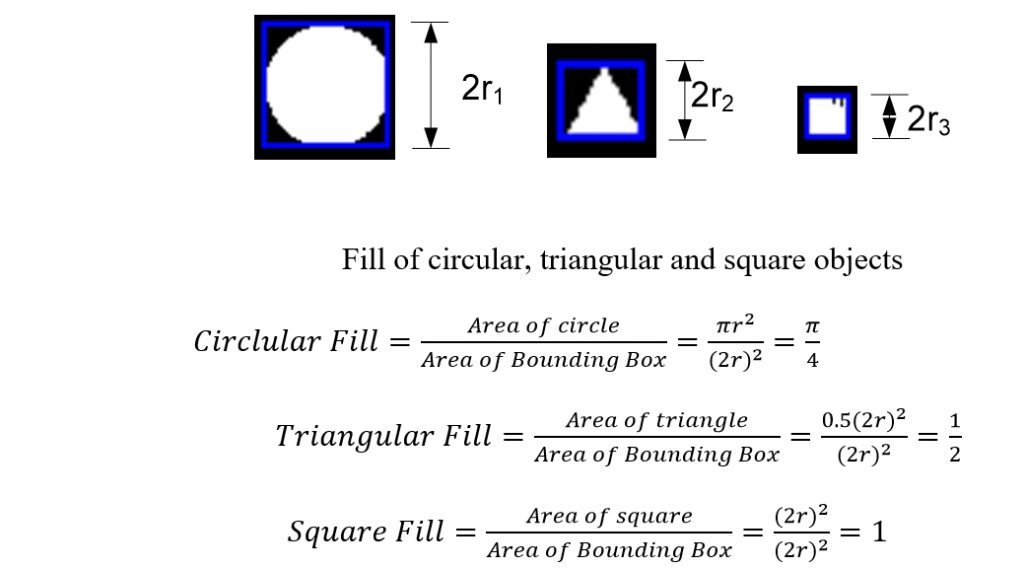
As the area of an ideal circle is , A=πr2 and area of the bounding box surrounding that circle must be 4r2,as shown in Figure below .Here r=radius of the circle, The ratio A circle /A bb =π/4. In other words, A circle is 78% of A bb . It was further assumed that if we allow this ratio to vary between +-10%, we can accommodate ellipses with increased eccentricity (circular traffic signs seen from angles other than right angles appear ellipses). For circles , the aspect ratio width/height of the bounding box must be 1, but the margin 10% enables us to include circular signs not taken exactly from the front. We consequently accept a sign to be circular blob if the above two conditions are satisfied.
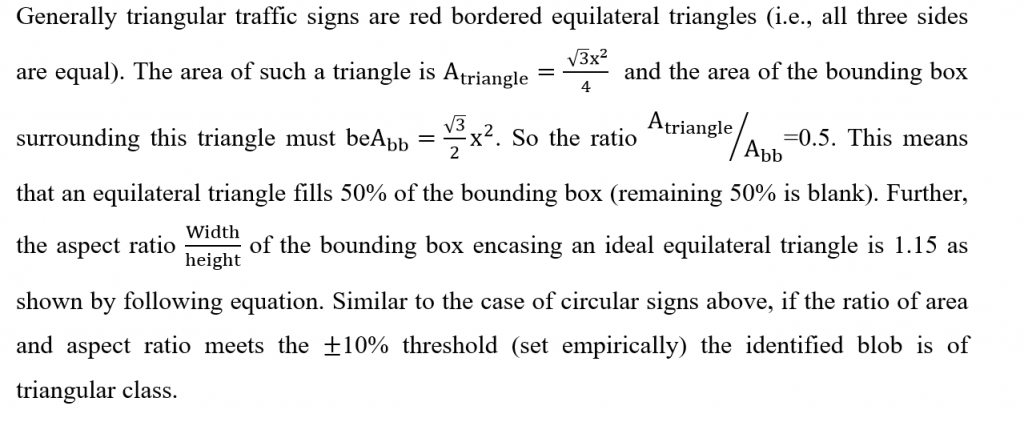
Triangular class identification:
Subimage:
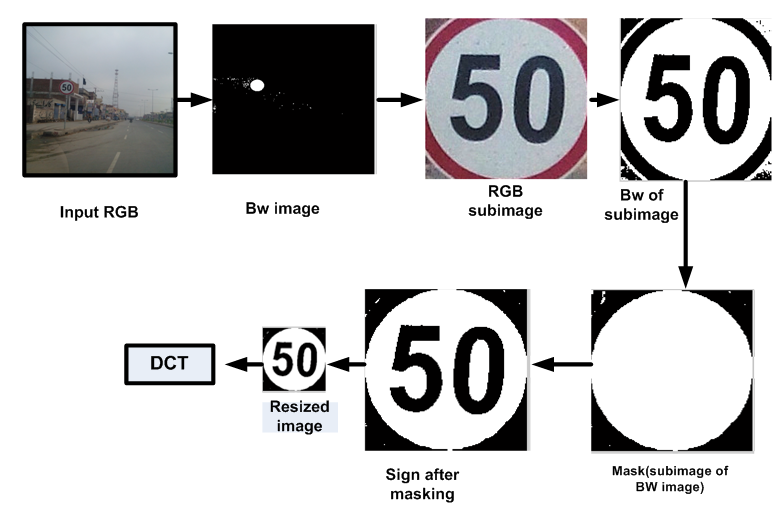
The next step is to extract the circular or triangular class sign from the real world scene. A subimage contains only the pixels of some small sub-region in an image, and that region is our target road sign. A subimage needs starting and ending coordinates, width and height of detected blobs satisfying the conditions stated in above equations . All these parameters are described by the bounding box. We therefore use them to take the desired portion of image out.
Our algorithm follows the following steps:
- Red bordered sign is detected from an RGB image and converted into grayscale image
- The grayscale image is threholded.
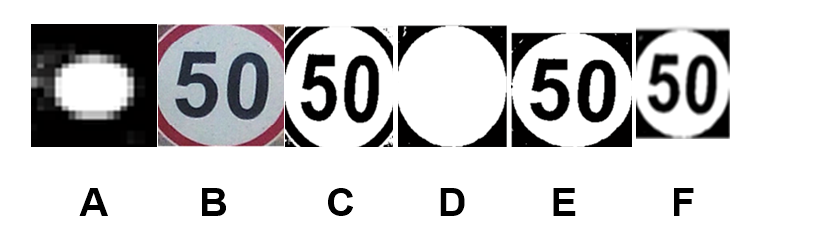
- A subimage of the binary image is extracted using the shape detection algorithm with the label D .
- The subimage of RGB image is extracted using the coordinates of bounding box, and is thresholded.
- For the recognition step, we need the contents of sign inside the red border-For this purpose, we mask the image C with image D to obtain resultant image E.
- Image E contains only the contents of the road sign, which is later on resized.
- Feature extraction is the next step to be performed.
Feature Extraction & Classification
Recognizing a speed sign means reading and making available the prevailing speed enforcement to the driver for his/ her assistance. The task is challenging as the image capturing angle, writing font (applicable in case of numbers), width of lines (in case of drawings) etc pose difficulties in extracting the distinguishing feature(s) in various scenarios .
Features are the reduced representation of an image. Features are extracted to avoid redundant information of an image and to process images for the preferred tasks. However, it is necessary to select the information carefully, so that feature set selected is the true representation of the image. Feature extraction is a very popular technique used in image processing. Most popular features of an image are edges. So some researchers prefer Haar like features Literature survey shows that histogram of oriented gradients(HOG) is yet another effective technique used for the said purpose.
Discrete Cosine Transform:
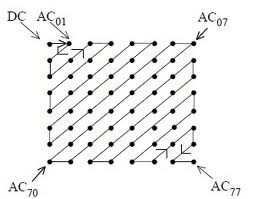
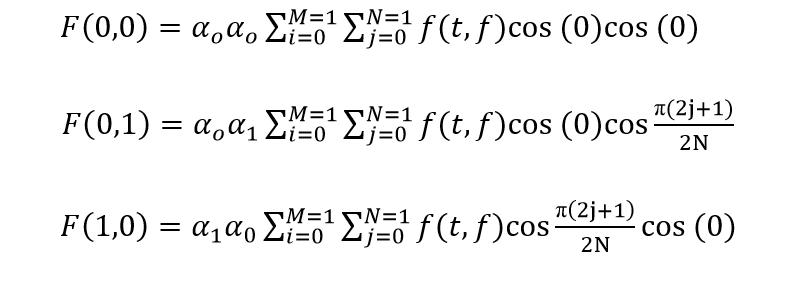
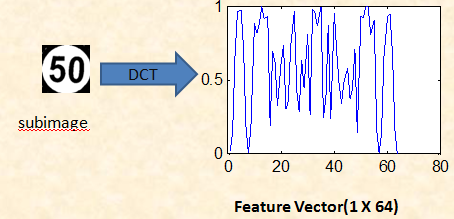
DCT is a powerful tool which is widely used for face recognition. Also it is used extensively in image compression techniques .DCT is similar to discrete Fourier transform (DFT) but it uses only real numbers. Conventional techniques take the transformation of the whole image and select coefficients form the zig zag pattern as shown in the Figure below. The DCT of an image principally consists of three frequency components low, middle and high. Each component contains diverse minutiae and information of the image. The low frequency component contains the average details of the image. So we will be using only the lowest frequency component of discrete cosine transform, as it contains most relevant information required for road sign recognition. The higher frequency components contains the finer details of the image. DCT is used for feature extraction because it packs the energy of the image in the upper left corner, hence allowing the use of a small feature vector as shown in the Figures.
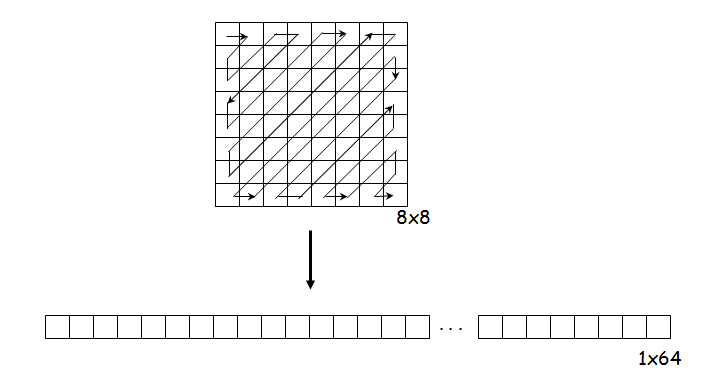
The method is used as follows:
- The image is divided in fixed number of blocks i.e. 8 x 8 blocks.
- A 2-dimensional DCT is applied on every block.
- The lowest DC component is retained to be the part of the feature vector.
- The result is a 1 x 64 feature vector.
Classification:
By classification, we mean to which category the image belongs. To perform this automatically, several machine learning algorithms exist. Here we have chosen the most popular one for the TSR systems; the K-nearest neighbor classifier .Researchers have also widely used support vector machine (SVM), but it has issues with non-linearly separable data.
The K-Nearest Neighbor Classifier:
In K-NN classification, the output is a class membership. An object is classified by a majority vote of its neighbors, with the object being assigned to the class most common among its K nearest neighbors. To apply classification algorithm data has to be divided into a test set and a training set. The training set consists of vectors, each with a class label stored as training samples only to be compared later. K is a constant whose value is defined by the user, is to classify a test sample to the nearest training sample (neighbor).
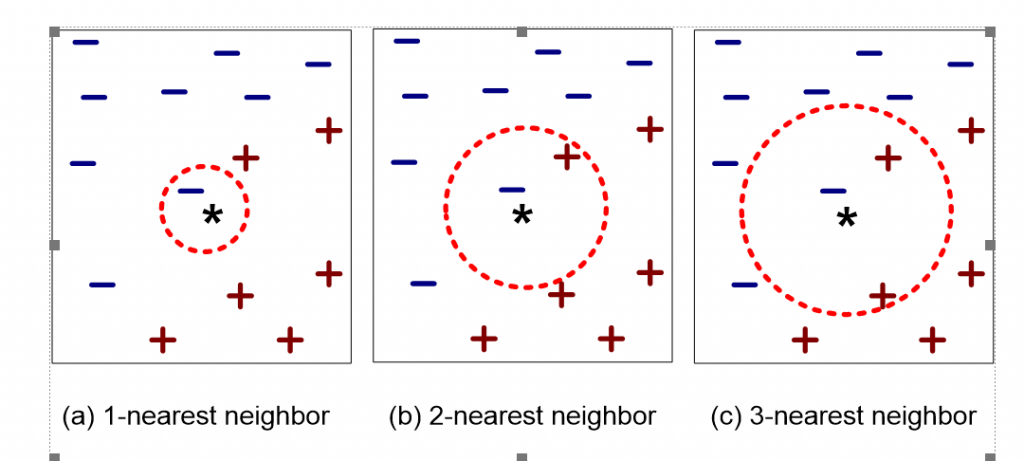
If K=1 it selects the nearest neighbor, but if K>1 then it selects the most frequent neighbors. Frequently used distance metric to calculate neighbor is Euclidean distance.KNN is basically an instance based classifier that requires three things, training data, distance metric, and value of K .
- Calculates the distance of sample with training data
- Identifies 3 nearest neighbors(as we are using K=3)
- By using class labels of nearest neighbors to determine the class label of sample image by majority vote
The working of K-nearest neighbor is depicted in Figure.Where’ *’is the test sample. It can either be classified as ‘-’ (first class) or ‘+’ (second class).K=1 test sample is classified to first class because there is only on ‘-’.Test sample is assigned to the first class when K=2.K is increased to 3 test sample is voted to second class as shown below.
Also read here