Introduction
In this article I have Discussed the Several System Design Examples using ASM Charts Clock. Designs for control units might be either basic or quite complicated. There are several approaches to creating control units. State diagrams and state table techniques can be used to create straightforward control units. Algorithmic charts can be used to construct complex control units in the same way that flowcharts are in software development.
ASM Charts
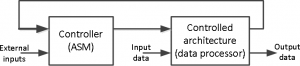
Similar to how specific flowcharts called Algorithmic State Machines (ASM) are helpful in software design, they are also helpful in the hardware design of digital systems. Data-path processing and the Control Path make up most digital systems. State machines, which may be realized using state graphs, are used to implement the control path. The complexity of the system’s control path (behavior) makes it more challenging to build the control path utilizing the state graph approach. When developing intricate and algorithmic circuits, the ASM charts approach is beneficial and practical. A complicated digital system is divided into a controller (to provide control signals) and a controlled architecture in the figure below (data processor).
A mixture of Mealy and Moore machines may be seen as the model of the Controller (ASM) block in the above diagram, as illustrated below.
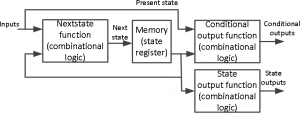
The ASM chart is different from a typical flowchart in that it must be constructed according to a set of rules. The ASM chart is identical to a state graph when these guidelines are followed, and it leads straight to a hardware realization. The three primary parts of an ASM chart are depicted in the diagram below.
A state box serves as the symbol for the system’s current state. The state box includes the name of the state and might also include an output list (just like in a state graph of the Moore machine). The top of the box may have a state code (if you want to assign a state code). There are always true and false branches in a decision tree. The decision box’s condition must be a Boolean expression, and this evaluation will determine which branch to choose. A conditional output list may be found in the conditional output box. The conditional outputs are influenced by the inputs as well as the system’s state (just like in the Mealy machine).
SM blocks are used to create the ASM chart. As seen here, each SM block has precisely one state box, along with decision boxes and conditional output boxes related to that state. One entry path and one or more exit pathways are present in an SM block. Every SM block specifies how the machine functions while it is in that state. A link path is a route that passes through an SM block from entry to exit.
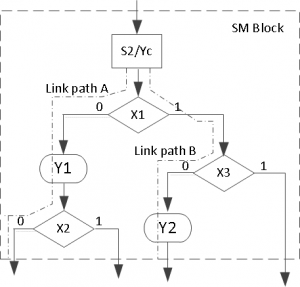
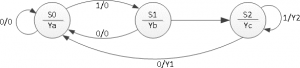
Let’s have a look at the sequential network state graph sample that is presented below. Mealy and Moore’s outputs are both present in this state graph. Because they are Mealy outputs, Y1 and Y2 ought to be conditional outputs. The Moore outputs Ya, Yb, and Yc should be included in the state box since they are. Since input X can only be either “0” or “1,” the decision box should include it.
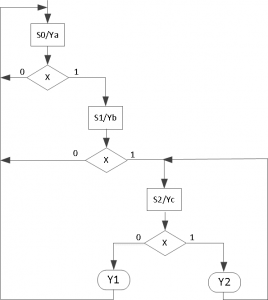
The ASM chart for the state graph mentioned above is seen below.
Once the ASM chart has been established, converting to HDL is simple. What transpires in each state may be specified using a case statement. Each condition box matches a certain if statement (or an else if). The functionality of the ASM chart shown above is represented by the following code.
module asm_chart(input clk, input x, output reg ya, output reg yb, output reg yc, output reg y1, output reg y2);
reg [1:0] state, next state; parameter [1:0] S0=0, S1=1, S2=2;
always @(posedge clk) // always block to update state state <= nextstate;
always @(state or x) // always block to compute both Mealy output & nextstate begin
y1 = 1’b0; y2 = 1’b0;
case(state) S0: if(x)
nextstate = S1; else
nextstate = S0; S1: if(x)
nextstate = S2;
else
nextstate = S0;
S2: if(x)
begin
y2 = 1’b1;
nextstate = S1;
end else begin
y1 = 1’b1;
nextstate = S0;
end
end default:
nextstate = S0; endcase
always @(state) // always block to compute Moore output begin
ya = 1’b0; yb = 1’b0; yc = 1’b0; case(state)
S0: ya = 1’b1; S1: yb = 1’b1; S2: yc = 1’b1;
default: begin ya = 1’b0; yb = 1’b0; yc = 1’b0;
end
end endcase
endmodule
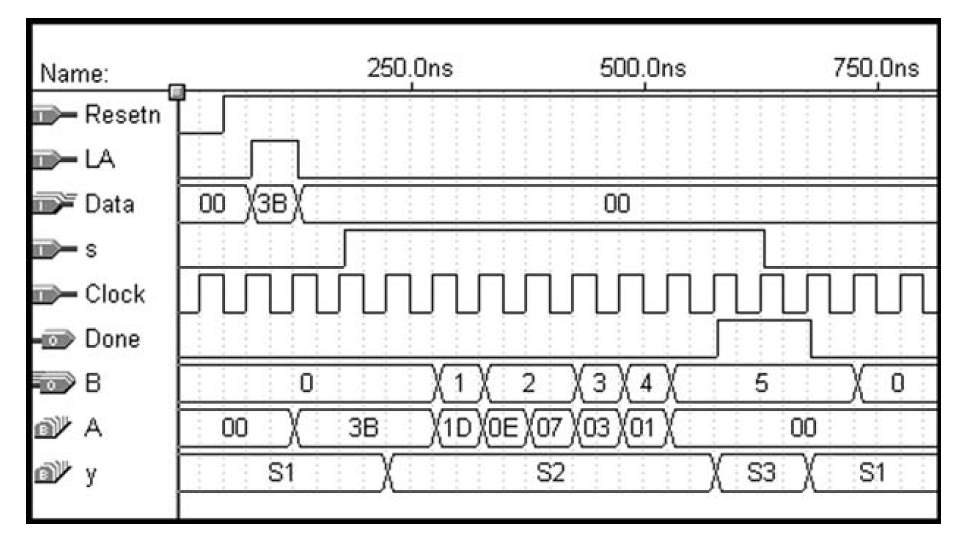
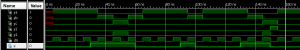
The following behavioral simulation result shows the above model functionality.
Conclusion:
Using the ASM chart approach, you also created a digital system to do binary multiplication and created a control unit that interfaced with the data-path processing unit.
Also read here:
- What are the Techniques for Testing Digital Circuits?
- What are Arithmetic Comparison Circuits? Explain with examples.
- How to Design Combinational Logic Circuits by using Metaheuristic Algorithm?
- What are the Transmission Gates?
- What are number systems in computer?
- Number System Conversions – Briefly Explained
- How to design Half adder and Full adder circuits?
- What are the decoders? how are they different from encoders?
- What is binary arithmetic? How to add, subtract, multiply and divide two binary numbers?
- What is the magnitude comparator circuit? Design a 3 bit magnitude comparator circuit
- How to design a 4 bit magnitude comparator circuit?
- How many hundreds are there in 1000?
- What are the synchronous counters? Explain with an example
- what are the BCD and binary ripple counters?